Debugger UI
The whole window at a glance, and what each area is for.
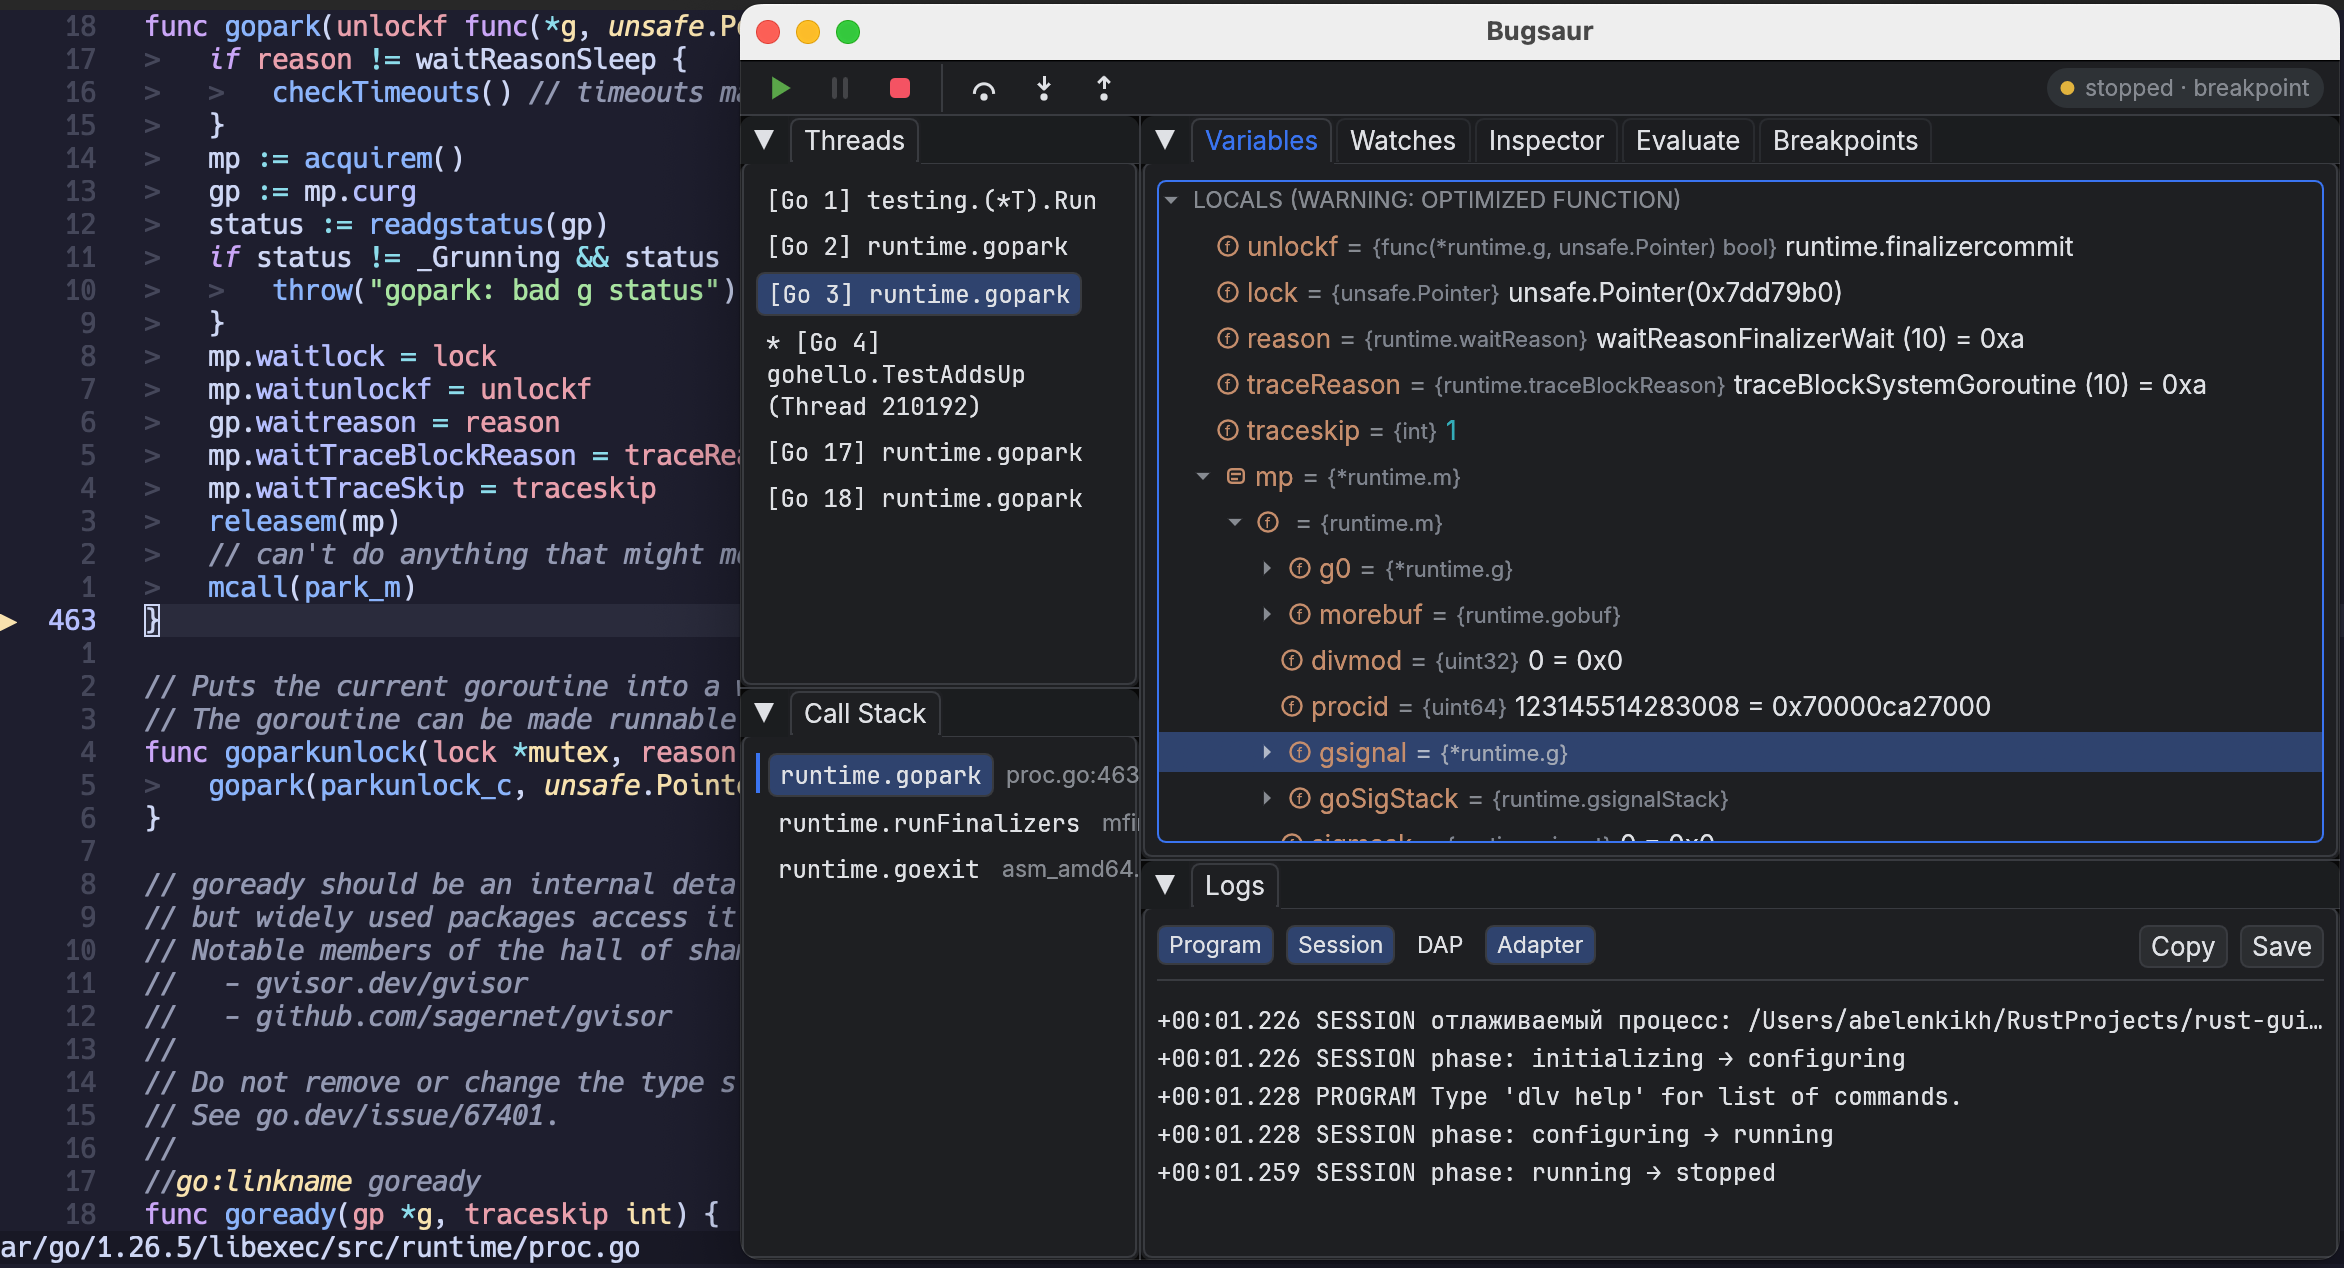
The zones
The window is split into a left column and a right area, each divided into two zones:
+----------------+-----------------------------+
|                |                             |
|   top_left     |            main             |
|   ① Threads    |   ③ Variables · Watches     |
|                |     Evaluate · Logs         |
|                |     Inspector · Breakpoints |
+----------------+-----------------------------+  ← main_split
|                |                             |
|  bottom_left   |          bottom             |
|       ②        |       ④ Call Stack          |
+----------------+-----------------------------+
        ↑ left_split          ↑ left
By default the left column holds Threads at full height, the right area holds a stack of tabs — Variables, Watches, Evaluate, Logs, Inspector, Breakpoints — with Call Stack below it.
Panels in one zone become a tab stack, in the order you list them. A panel not named in any zone is not shown at all — that is how you remove one.
The zones and the proportions between them are set by the project, in the
[ui.layout] section: see Configuration → UI.
The execution toolbar
Along the top: continue, step over, step into, step out, stop, restart. Each button has a keyboard equivalent that works everywhere in the window — including while the cursor sits in the Evaluate or Watches input field.
| Key | Action |
|---|---|
| F9 | continue |
| F8 | step over |
| F7 | step into |
| Shift+F8 | step out |
| Cmd+F2 / Ctrl+F2 | stop |
Details of what each one means: Stepping.
Focus: one active panel
Exactly one panel is active for the keyboard. You can tell which one two ways: its tab title is accented, and its body is framed. The title is visible even when the panel is too narrow to show the frame clearly.
| Chord | Effect |
|---|---|
| Tab / Shift+Tab | next and previous panel, cyclically |
| Ctrl+Tab / Ctrl+Shift+Tab | the same |
| Ctrl+T | Threads |
| Ctrl+C | Call Stack |
| Ctrl+V | Variables |
| Ctrl+W | Watches |
| Ctrl+E | Evaluate |
| Ctrl+L | Logs |
| Ctrl+I | Inspector |
| Ctrl+B | Breakpoints |
The cycle covers the whole window, not the tabs of one stack. A panel sitting as a background tab comes to the front when you move to it. The letter belongs to the panel, not to its position in the layout — and the letter of a panel your layout does not show does nothing at all. Focus starts on Variables.
Why Tab and not arrow keys
egui's own widget traversal is switched off: focus never lands on toolbar buttons, and arrows do not drag it between them. There is exactly one kind of navigation in the window — panels and rows — which is why Tab was free to take panel switching.
Moving inside a panel
| Keys | Effect |
|---|---|
| J / K, Down / Up | previous and next row |
| G / Home, Shift+G / End | first and last row |
| H / L, Left / Right | collapse and expand a tree node |
| Enter / Space | activate |
| Esc | leave an input field |
What "activate" means depends on the panel:
| Panel | J / K | Enter |
|---|---|---|
| Threads | move the cursor | select the thread |
| Call Stack | selects the frame immediately | — |
| Variables | move the selection in the tree | collapse / expand the node |
| Watches | move between expressions | enter the input field (D / Del removes) |
| Evaluate | — | enter the input field |
| Logs | scroll one line | — |
| Breakpoints | move the selection | open the location in the editor |
Shift+G in Logs re-enables following the tail of the feed; G turns it off.
Variables has a search of its own: / opens it, N and Shift+N walk the matches. It reaches into structures that have not been opened yet, and Variables describes what it covers and what bounds it.
While the cursor is in a text field, letters stay letters — they do not trigger navigation. Chords with a modifier, function keys, Esc and Tab still work from there: Tab cannot be part of an expression, and leaving for the next panel is exactly what people expect of it.
Themes and fonts
The window ships both a dark and a light scheme; the project decides which one shows:
The default is dark, not system. The debugger window opens next to your
editor rather than instead of it, and it should follow the OS setting only when
asked — that is what system is for, and with it the theme switches on a live
session.
Colour in the variable tree means the kind of value, not the importance of the
row: strings green, numbers and booleans blue, nil dimmed, the type grey in
braces. Contrast is verified by a test for every colour on every background in
both themes — 4.5:1 for primary text, 3:1 for secondary.
Full theme rules and precedence against the editor: see Configuration → UI.
Getting help in the window
F1 or ? shows the bindings currently in effect — the result of all four configuration layers, not the defaults printed in the documentation. When a key does something other than what you expect, that panel is the authority.