Your First Debug Session
This page goes from a project you have never debugged with Bugsaur to a debugger stopped on a breakpoint, showing you a variable. It takes a few minutes.
Every step says what should happen. When it does not happen, the step says where to look.
Before you start
You need bugsaur on PATH and an adapter for your language. If you have not
done that yet, do Installation first and come back.
The walk-through uses Rust as its example. The shape is identical for the other
languages — only the adapter and the program value change.
Step 1 — Describe the project
In the project root:
What should happen: a file appears at .bugsaur/config.toml, and the command
prints where it wrote it.
Nothing was generated
init needs a language marker to recognise the project. It looks for
Cargo.toml, go.mod, composer.json, pyproject.toml, setup.py or
requirements.txt — searching upwards from where you ran it.
If your project has none of those, or its entry point sits somewhere unusual, write the config by hand. It is short — see Configuration → Profiles.
Step 2 — Check the profile
Open .bugsaur/config.toml and read it. This is the one step people skip, and
it is the one that causes most first-session failures: init writes a
reasonable guess, not a verified truth.
Two things to confirm:
adapternames an adapter you actually installed.programpoints at the right thing. For Rust and C/C++ that is a compiled binary; for Go a package directory; for Python a script; for PHP the project directory.
Step 3 — Build the program
For Rust, the artifact in program must exist before launching:
What should happen: target/debug/app exists.
Go is built by Bugsaur itself before the adapter starts. Python and PHP have nothing to compile.
Step 4 — Choose a line to stop on
Pick a line that certainly runs — the first line of main is a safe choice.
Note the file and line number; you will pass them as file:line.
A line must be executable to hold a breakpoint. Blank lines, comments and declarations are not: the adapter will either move the breakpoint to the next executable line or refuse to bind it.
Step 5 — Launch
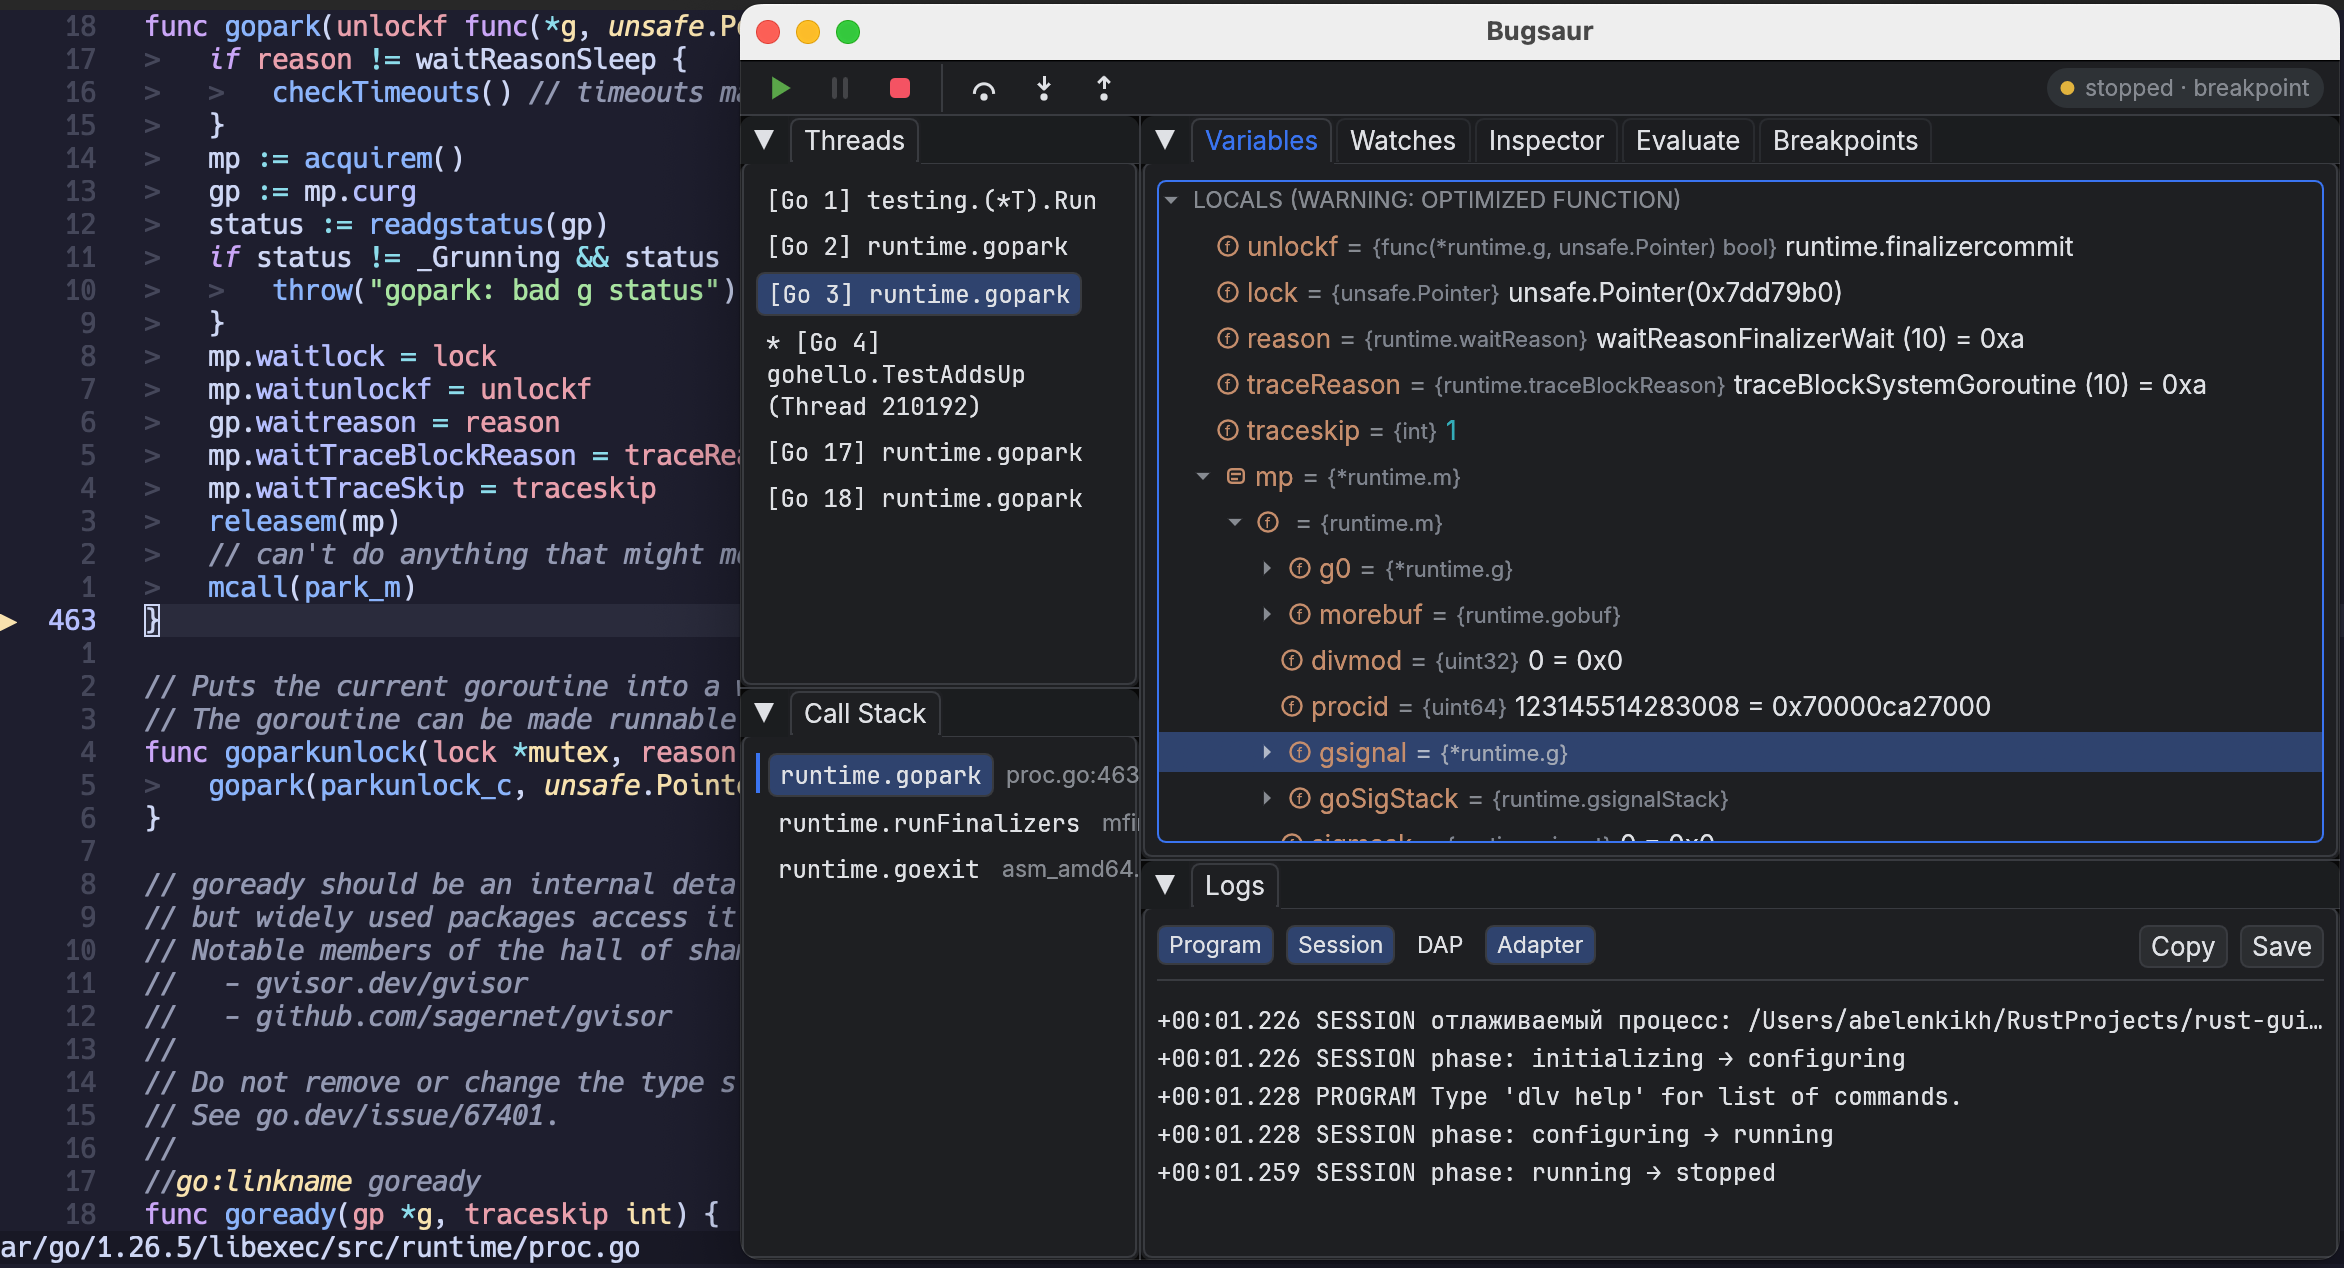
What should happen: a window opens. Briefly it shows the session starting, then the program runs and stops. The source panel shows your file with the current line marked, and the panels fill with data.
The window opened but nothing happened
Open the Logs panel — Ctrl+L. It carries four sources: Program
(your program's output), Session (phase changes, adapter start and death,
failed DAP requests), Adapter (the adapter's own stderr) and DAP (the
request trace, off by default because it is the noisiest).
Turn on Session and read from the top. Typically it names the problem
directly — an adapter that could not start, or a launch that was refused.
The program ran to completion without stopping
The breakpoint did not bind, or it bound somewhere the program never reached. In the Breakpoints panel — Ctrl+B — each breakpoint carries a circle showing what the adapter said about it:
- filled: the adapter confirmed it;
- yellow ring: not confirmed — the line may not be executable;
- dimmed ring: no answer yet.
It stopped, but the source shown is wrong or missing
The debugger and the debuggee disagree about paths. This is normal for anything running in a container or on another machine, and it is fixed with path mappings — see Troubleshooting → Source not found.
Step 6 — Look around
You are stopped. Now read the state:
- Variables (Ctrl+V) — everything in scope, as a tree. Expand a structure with Right or L. Colour tells you the kind of value: strings green, numbers and booleans blue, types grey in braces.
- Call Stack (Ctrl+C) — how execution got here. Moving the cursor selects a frame, and the other panels follow it.
- Threads (Ctrl+T) — every thread the adapter reports.
Panels are cycled with Tab and Shift+Tab, or jumped to directly with Ctrl+T, Ctrl+C, Ctrl+V, Ctrl+W, Ctrl+E, Ctrl+L, Ctrl+I, Ctrl+B. The active panel has a highlighted tab and a framed body.
Step 7 — Move
| Key | What it does |
|---|---|
| F8 | step over — run this line, stop on the next |
| F7 | step into — enter the call on this line |
| Shift+F8 | step out — run until this function returns |
| F9 | continue — run until the next breakpoint |
Step a few lines and watch the Variables panel change as values update.
Step 8 — Ask a question
Open Evaluate (Ctrl+E), press Enter to enter the input field, and type an expression in your program's language. It is evaluated in the currently selected stack frame, and the result appears below.
To keep an expression on screen across every stop, add it in Watches (Ctrl+W) instead. Watches are re-evaluated on each stop.
Step 9 — Finish
Press Cmd+F2 (or Ctrl+F2) to terminate the session, or just close the window.
What you have learned
You now know the whole loop: describe the project once, launch, stop, inspect, step. Everything after this is detail.
Where to go next depends on what you want:
- Your language's specifics, including its adapter's quirks — Languages.
- Every panel in depth — Debugger UI.
- Driving all of this from the editor — Neovim.
- Task-shaped recipes like debugging
cargo testor PHP inside Docker — Guides.